The data shows that 2022 has been the year of fear in the cryptocurrency market, as investors have continued to show unfavorable sentiment for around eleven months.
Crypto Fear And Greed Index is currently in “Extreme Fear” territory
According to the latest weekly report from Arcane Research, the cryptocurrency market could soon complete a full year of fearful sentiment.
The relevant indicator here is the “fear and greed index”, which tells us about the general sentiment among investors in the crypto market.
The metric uses a numerical scale from zero to one hundred to represent this sentiment. All values above fifty imply a greedy mood, while those below the threshold suggest an air of fear.
Outside of these two feelings, there are also two subsets of feelings, “extreme fear” and “extreme greed.” These occur at values towards the extremes of the range. That is, those over 75 for the former and those under 25 for the latter.
Now, here is a chart showing the trend in the crypto greed and fear index over the past year:
The value of the metric seems to have been moving sideways during recent weeks | Source: Arcane Research's The Weekly Update - Week 41, 2022
As you can see from the chart above, the current long period of fear began in mid-November last year when the bull run died down.
Since then, apart from a few greed spikes, the crypto greed and fear index has remained below a value of fifty.
During this period, the metric has spent a significant amount of time in extreme fear territory, meaning investors have been in a deep bottom mindset in 2022.
The last value of the indicator was 22, which means that investors are extremely fearful at the moment. This is not much different from last week, which saw a value of 24.
The gauge below shows where the current market is compared to last week and last month.
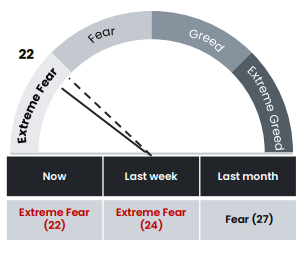
The fear and greed index points at extreme fear right now | Source: Arcane Research's The Weekly Update - Week 41, 2022
BTC price
At the time of writing, the price of Bitcoin hovers around $19,200, up 1% in the last seven days. Over the past month, the crypto has lost 1% in value.
Below is a chart showing the price trend of the coin for the past five days.

Looks like the value of the crypto has continued to be stuck in a range over the last few days | Source: BTCUSD on TradingView
Featured image from Hans-Jurgen Mager on Unsplash.com, charts from TradingView.com, Arcane Research


